The Past Performance (PP) tab shows the same list of sectors as the Sectors tab. NOTE – the sector classification shown on the PP tab will follow the sector classification choice made on the Sectors tab. If no sector classification choice has been made on the Sectors tab, the selection will need to be made on the PP tab before the sector list is generated.
Within each sector there are fields for various past performance metrics – you can view the fields within each sector by clicking on the sector name to “open” it.
In the screenshot below the list is being filtered so that it only includes contracts which have a UK equity fund with positive alpha.

(It’s also worth noting that a filter such as this is also implicitly filtering out any contracts which don’t have a UK equity fund with at least 3 years of past performance history, because alpha is measured over 3years.)
The list of fields within each sector is as follows (and this full list is only available for customers who have paid for the premium edition of Synaptic Research).
- Past performance over 6 and 9 months, plus 1, 2, 3, 4, 5, 6, 7, 8, 9 and 10 years.
- Volatility (over 3 years).
- Alpha (over 3 years, compared to the sector average).
- FE Crown rating.
- Quartile consistency.
All these items are defined below.
Showing which fund is being used
As described in the section on past performance data, the system calculates a contract’s past performance in a sector by taking the single best-performing fund which is available. In the below example, the contracts remaining in the list have at least one UK equity fund with positive alpha. They may have other funds in the same sector with negative alpha.

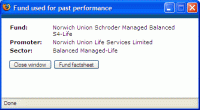
You can see which fund is being used for a particular field by adding the field to the grid, clicking on one of the values in the new column, and choosing Show Fund from the pop-up menu. This displays the window illustrated by the screenshot to the right.
