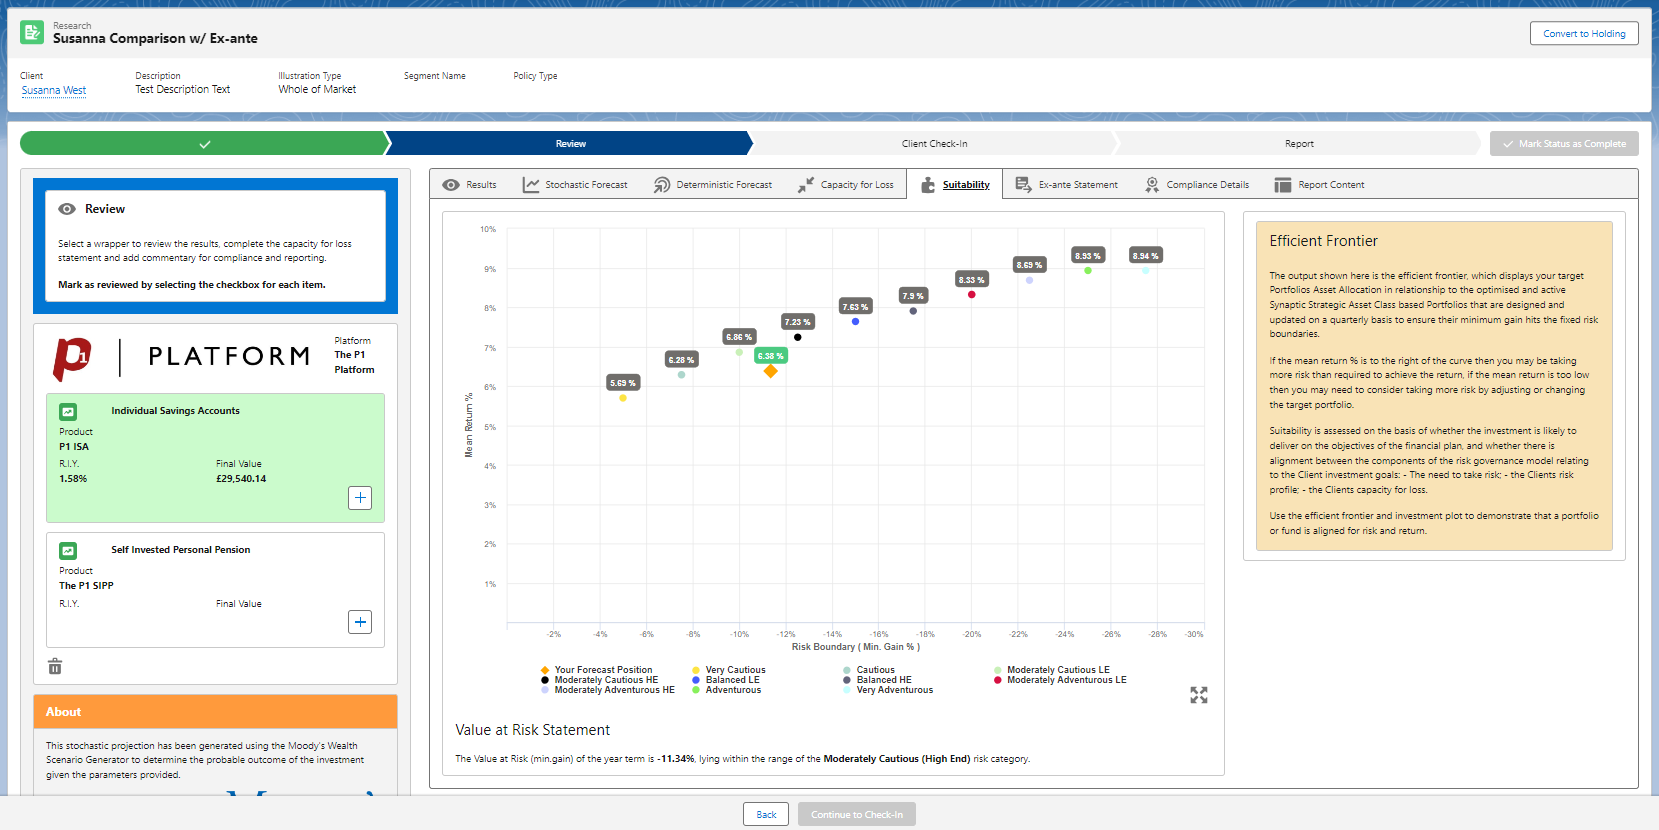
The Suitability tab will display an Efficient Frontier graph:

Included in this screen is a Value at Risk Statement at the bottom of the graph:

Next tab to review is the Ex-Ante Statement. See article Basis of Illustration - Ex-Ante Statement.
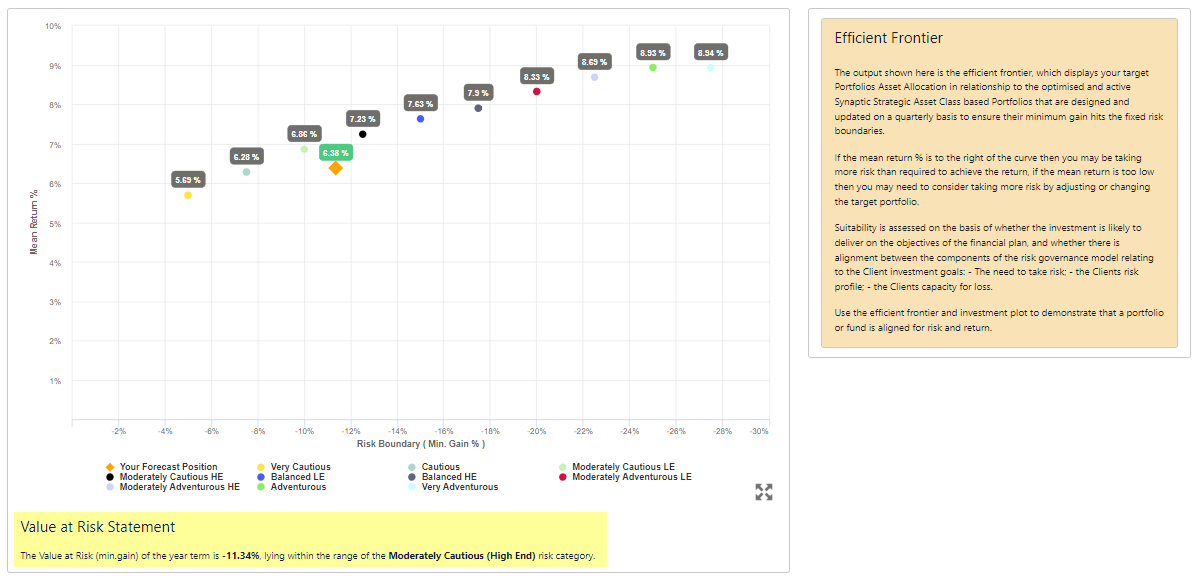
The Suitability tab will display an Efficient Frontier graph:

Included in this screen is a Value at Risk Statement at the bottom of the graph:

Next tab to review is the Ex-Ante Statement. See article Basis of Illustration - Ex-Ante Statement.

Thank you! Your comment has been submitted for approval.